#06 DEBUG & ATTACH: HOW TO DEBUG WEB SERVICES AND JOB QUEUE
Finding and fixing bugs or errors is part of our daily tasks. This process may take a lot of time if we do not use the debugger and, even more, if the error occurs in a Web Service or in a Job Queue task.
In the older versions, the solution was to use the “Debug Next” functionality, but in Visual Studio Code that functionality is not present. No problem, we’ll use Attach.
1 Create a basic Web Service Codeunit
A new Codeunit was created with a method that returns a random color.
![]() 2 Publish the Codeunit as a Web Service in Business Central
2 Publish the Codeunit as a Web Service in Business Central
After publishing, make sure you can access the SOAP URL.
![]() 3 In VS Code, add a new “attach” configuration in launch.json
3 In VS Code, add a new “attach” configuration in launch.json
![]() 4 Set the Breakpoint in VS Code and start a Debug Session with “Debug without publishing (Ctrl + Shift + F5)” and select the “Attach: BC180” configuration
4 Set the Breakpoint in VS Code and start a Debug Session with “Debug without publishing (Ctrl + Shift + F5)” and select the “Attach: BC180” configuration
![]() 5 Use SOAP UI (or Postman) to call the Method
5 Use SOAP UI (or Postman) to call the Method
![]() 6 The debugger will break on the Breakpoint
6 The debugger will break on the Breakpoint
![]()
Notes:
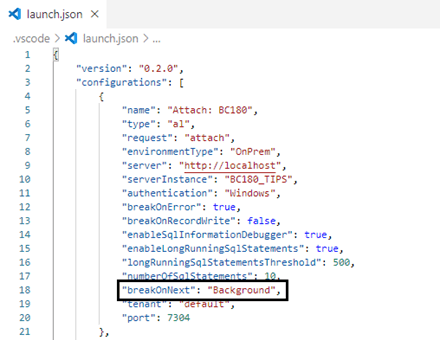
- The example above will also work with Job Queue if you change the “breakOnNext” property to “Background” in the attach configuration in launch.json.
 To attach the app must be firstly published without debugging, before you start the debugging session (A).
| (A) https://docs.microsoft.com/en-us/dynamics365/business-central/dev-itpro/developer/devenv-attach-debug-next |


