Business Value
End users and data analysts can analyze data from list pages directly in the client without the need to open the page in Excel or run a report.
The ability to analyze data directly in list pages raises the bar for what you can do without having to switch applications, while still allowing customers and partners to do more in report objects, Excel, Power BI, or other data analysis applications.
How does it work?
Analysis mode is a new way of interacting with data on list pages. Instead of running reports using different options and filters, you can simply add multiple tabs that represent different tasks or views on the data.
1. In the action bar at the top of the list page, turn on the Analyze toggle switch.
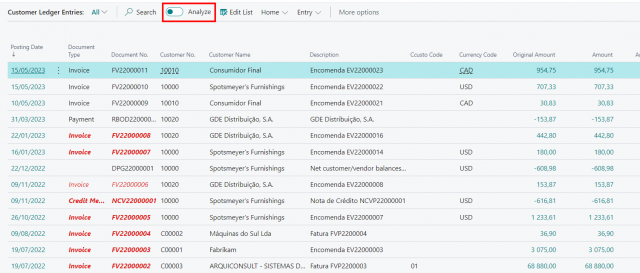
Analysis mode opens the data in a optimized way for data analysis. The page is split into two areas: the main data area (including a Tabs pane) and the field modifier area.
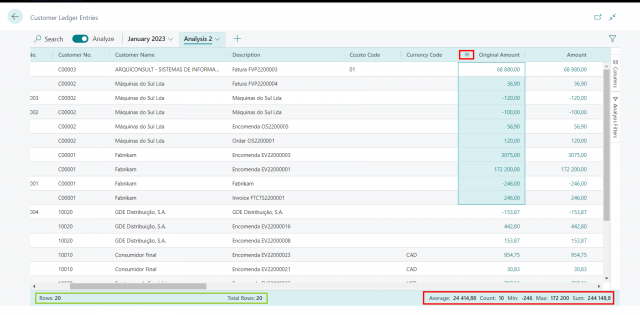
2. Use the data area to interact with the data. Move and drag columns, select the menu icon to pin columns and other options.
Columns that are summable, you can easily get descriptive statistics on a set of fields by marking them. The bottom of the data area also shows the total row count on the column.
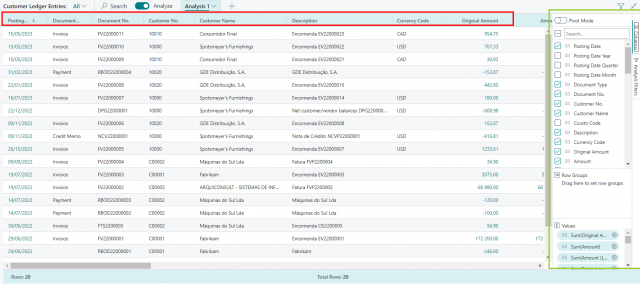
3. Use the field modifier area to control the data to show and its format. On the menu, you select the fields to show or hide. Group data is also possible by dragging fields to the Grouping part of the Columns menu.
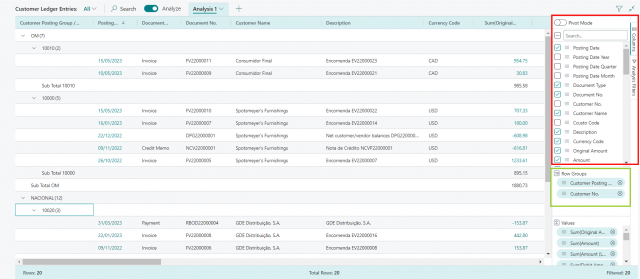
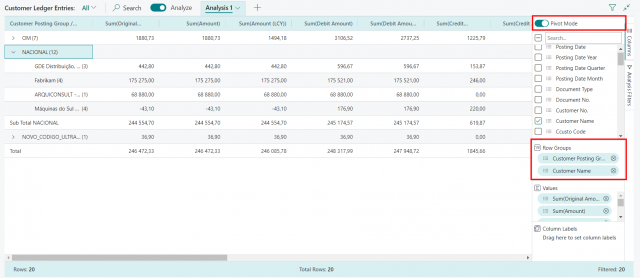
4. Other great way of grouping is using the pivot mode. To enable pivot mode, turn on the Pivot Mode toggle switch and then drag fields that are to be summed to the Values part. The pivot mode is like pivot tables in Microsoft Excel.
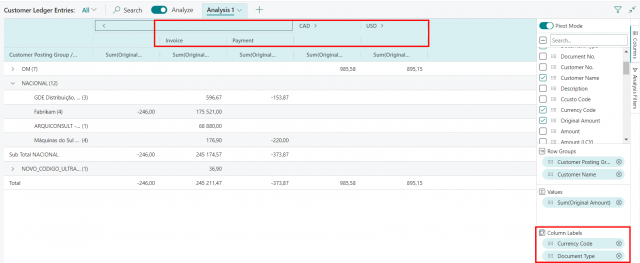
In pivot mode, you can define groups that show up in the column part of the data area. Do this by dragging fields to the Column Labels part of the Columns menu.
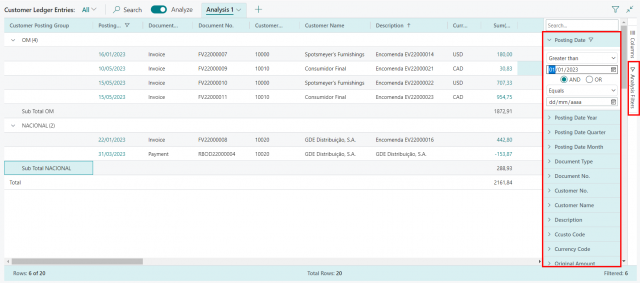
5. Use the Analysis Filters menu of the field modifier area to apply more filters to the dataset. To set a filter, select the column, choose the comparison operation from the list (like Equals or Starts with), then enter the value.
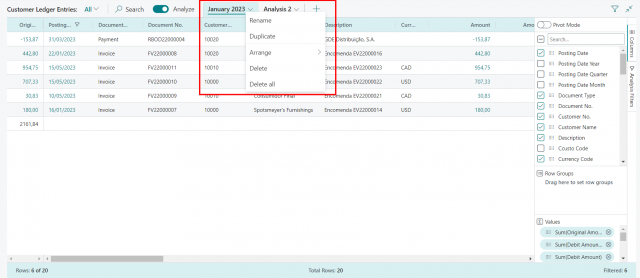
It is possible to save multiple column setups and filters. The next time you switch to analysis mode you can dive straight in to analyzing data. On the Tabs pane, you can rename or remove and add new tabs.
Limitations
On a list page, as a starting point you can set filters to limit the data. You don’t have to do this prefiltering step, but going to analysis mode will load all data into your browser, so it might be needed for larger datasets (currently above 100,000 rows).
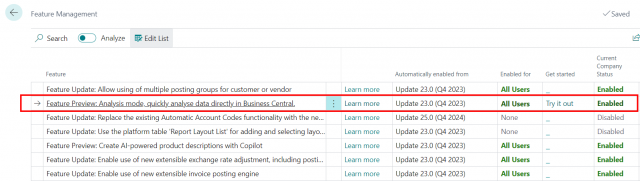
To try it out, go to the Feature Management page and enable Analysis mode.